
What Is Amazon BSR and How Does It Relate to Book Sales?
Amazon Best Sellers Rank (BSR) is a relative ranking that shows how a book is performing compared to other books in the same marketplace and category. It is not a direct sales number, but it updates frequently in response to real customer purchases.
In simple terms, a lower BSR usually means higher sales velocity, while a higher BSR indicates slower sales. Because Amazon does not publicly disclose exact KDP sales data, BSR has become the most widely used public signal for estimating demand.
While BSR cannot tell you the exact number of copies sold, it follows recognizable patterns that allow for practical estimation when used correctly.
Important: Always use BSR from the same marketplace and the same format (Kindle vs Paperback). BSR behaves differently across categories and countries, so treat estimates as a range — not a precise sales report.
What this BSR calculator estimates:
- Estimated daily and monthly units sold based on Amazon BSR
- Approximate KDP royalties for Kindle ebooks and Paperback books using typical Amazon royalty rules
- Paperback printing costs calculated from page count and ink type (black & white or color)
- A monthly sales breakdown with a visual trend chart to reflect seasonality and long-term performance
- Kindle Unlimited reads, category differences, and ranking volatility
- Ads and promotions that create spikes (or drops) in sales velocity
- Returns and price changes that shift royalties and sales behavior
- Marketplace differences (Amazon.com vs other countries)
Use these estimates to compare niches, evaluate competitors, and test pricing or ad scenarios. Treat the output as an informed approximation — not official Amazon reporting.
Quick Setup: Inputs That Affect Your BSR Estimates
A BSR estimate is only as good as the inputs you use. To get realistic projections (sales volume, royalties, and paperback profit margin), make sure your BSR snapshot, format, and price match the exact book version you’re analyzing.
Below is a quick guide to the key inputs and the most common mistakes that cause unrealistic numbers.
- Use a recent BSR snapshot (same day if possible), not an average.
- Match the format (Kindle vs Paperback) — don’t mix ranks across editions.
- Keep the marketplace consistent (Amazon.com vs other countries).
Key inputs explained:
- Best Sellers Rank (BSR): Enter the current BSR for the exact edition you’re checking. BSR moves quickly, so older screenshots can mislead your estimate.
- Marketplace and category context: BSR is marketplace-specific and behaves differently across categories. For best consistency, use BSR from the same marketplace (this estimator is primarily calibrated for Amazon.com).
- Book format (Kindle or Paperback): These formats have different buying patterns and royalty logic. Selecting the correct one is the #1 step for a believable estimate.
- List price: Price changes royalties dramatically. Kindle royalties typically follow different rates depending on price range; Paperbacks depend on price minus printing cost (margin).
- Quarter / seasonality: Demand often shifts by season. Choosing the quarter helps the monthly trend reflect more realistic distribution across the year.
- Page count and ink type (Paperback only): Printing cost depends on page count and ink (black & white vs color). These values directly affect estimated paperback royalties and profit margin.
Quick reference (Input → what it changes → common mistake)
| Input | What it changes | Common mistake |
|---|---|---|
| BSR | Estimated units sold (day/month) and trend baseline | Using an old snapshot or mixing categories/marketplaces |
| Format | Sales curve + royalty logic (Kindle vs Paperback) | Using Kindle BSR for Paperback (or the other way around) |
| Price | Royalties per unit and revenue scenarios | Forgetting that a small price change can shift royalties a lot |
| Quarter | Monthly distribution / seasonality weighting | Comparing Q4 estimates to Q1 without accounting for seasonality |
| Pages + ink | Paperback print cost → margin → royalty estimate | Leaving pages blank or choosing the wrong ink type |
Tip for scenario testing: change one input at a time (price, format, or quarter) to see what truly drives sales and royalty projections. This makes the calculator useful not only as a sales estimator, but also as a quick royalty and profit check for KDP decisions.
How to Read and Interpret Your BSR Results
A BSR calculation is not meant to give you an exact sales figure. Instead, it provides a structured estimate that helps you understand demand, compare opportunities, and make better KDP decisions.
To use the results correctly, it’s important to know what each number represents — and how to interpret it in real-world conditions.
What the numbers actually mean:
- Units sold (daily / monthly): An estimate of how many copies a book might sell on average. Real sales fluctuate day to day, especially during promos or ads.
- Royalties: Estimated earnings after typical Amazon KDP fees. These numbers do not include ad spend, editing, cover design, or other external costs.
- Monthly breakdown: A distribution of sales across months to reflect seasonality. It helps visualize trends rather than predict exact dates.
- Chart view: A visual aid to spot relative highs and lows, not a guarantee of future performance.
- Think in ranges, not single numbers. A result of 5–8 sales/day is more realistic than “exactly 6”.
- Expect volatility. Ads, promotions, and category shifts can temporarily distort BSR-based estimates.
- Compare books within the same format and categoryfor meaningful insights.
- Use the calculator for relative comparison, not for accounting or financial reporting.
Why your estimate may differ from other tools
Different BSR calculators often show different numbers. This does not mean one is “wrong” — it reflects different assumptions and data interpretation.
- Some tools assume higher or lower sales velocity for the same BSR.
- Seasonality and category weighting may be handled differently.
- Royalty assumptions (price tiers, print cost models) can vary.
The strength of this calculator is consistency. When you use the same assumptions across multiple books or scenarios, you gain a reliable framework for comparison — which is far more useful than chasing a single “perfect” sales number.
Common Use Cases for an Amazon BSR Calculator
Authors, publishers, and marketers use BSR-based estimates in different ways. The calculator is not limited to one task — it helps answer practical questions about demand, revenue potential, and competitive landscape.
The table below shows common use cases and which parts of the calculator matter most in each situation.
| Goal / intent | How to use the calculator | Focus on |
|---|---|---|
| Niche research | Check BSR ranges for several competing books in the same category and format. | Monthly units sold and relative demand |
| Competitor analysis | Compare your book’s BSR to similar titles with comparable price and format. | Sales ranges, not exact numbers |
| Pricing decisions | Test different price points to see how royalties and margins change. | Royalties per unit and total revenue |
| Paperback profit check | Enter page count and ink type to estimate printing cost and margin. | Net royalty per sale |
| Ad and promo planning | Compare estimated sales before and after expected rank improvements. | Break-even and upside potential |
| Launch planning | Use quarter and seasonality to estimate early traction and momentum. | First-month sales expectations |
In all cases, the calculator works best as a comparison tool. When you apply the same assumptions across multiple books or scenarios, you gain clarity about relative opportunity — which is far more valuable than chasing a single “perfect” sales estimate.
Kindle vs Paperback: What Changes and Why It Matters
Kindle and Paperback editions behave differently on Amazon. They can have different demand patterns, royalty rules, and cost structures — which means the same-looking BSR value may imply different sales and earnings depending on the format.
Use the cards below to understand what changes between formats and how to interpret estimates more realistically.
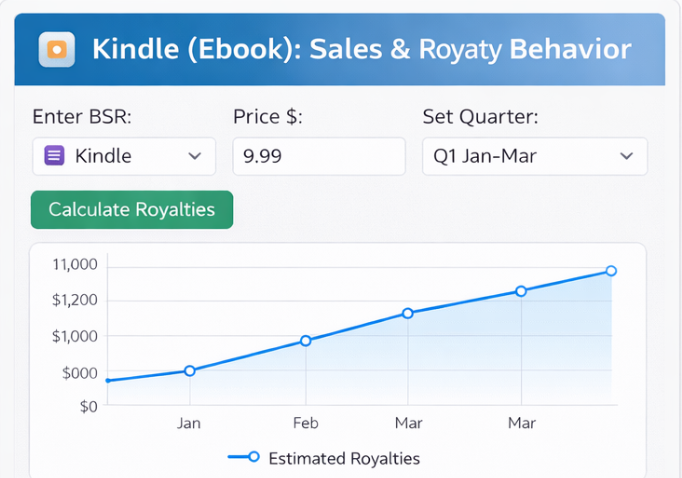
Kindle (Ebook): Sales & Royalty Behavior
Kindle royalties usually depend heavily on price tiers and the selected KDP royalty rate. Kindle demand can also be more sensitive to promotions, pricing changes, and short-term visibility boosts.
- Best for: quick sales estimation, pricing experiments, competitor checks
- Royalties: typically based on price tier rules (e.g., standard vs lower-priced)
- Volatility: can spike during ads, promos, and rank movement
Tip: When comparing Kindle books, keep category and marketplace consistent and think in ranges rather than exact daily sales.
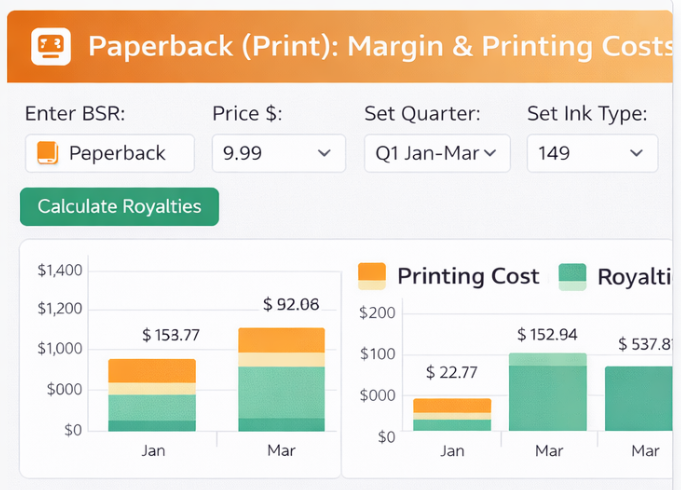
Paperback (Print): Margin & Printing Costs
Paperback royalties depend on list price minus printing cost. Page count and ink type (black & white vs color) directly impact your margin, which is why paperback estimates often need more inputs.
- Best for: profit checking, margin planning, print-focused niches
- Royalties: price minus estimated printing cost (margin-based)
- Key inputs: page count + ink type (B&W or color)
Tip: If your paperback margin looks low, test price and page count scenarios to see what changes royalties most.
Bottom line: Always compare Kindle to Kindle and Paperback to Paperback. Mixing formats is the fastest way to get misleading conclusions from BSR estimates.
Paperback Printing Costs and Profit Explained
Paperback royalties work differently from Kindle royalties. Instead of a percentage-based payout, your earnings depend on how much remains after Amazon deducts the printing cost from the list price.
Understanding this relationship is essential if you want to use a BSR calculator as a true profit checker, not just a sales estimator.
How paperback royalties are calculated
In simple terms, paperback royalties follow this structure:
- List price — the price you set for your paperback
- Printing cost — determined by page count and ink type (black & white or color)
- Royalty per sale — the remaining margin after printing cost is deducted
Two paperback books with the same BSR and price can earn very different royalties if their page counts or ink types differ.
Why page count and ink type matter so much
Printing cost increases as page count grows, and color interiors are significantly more expensive than black & white. This means profit margins can shrink quickly — even when sales volume looks healthy.
- Higher page count → higher printing cost
- Color ink → much higher cost per page
- Thin margins → small pricing mistakes become expensive
Practical paperback examples
| Scenario | Pages / Ink | List price | Estimated print cost | Royalty per sale |
|---|---|---|---|---|
| Low-content book | 100 pages / B&W | $9.99 | Low | Healthy margin |
| Standard nonfiction | 200 pages / B&W | Medium | Moderate margin | |
| Color workbook | 150 pages / Color | High | Thin margin |
How to use this calculator for paperback profit checks
- Enter an accurate page count and select the correct ink type before trusting royalty estimates.
- Test multiple price points to see how margin changes. A small price increase can dramatically improve profitability.
- Compare paperback profit against Kindle royalties to decide which format deserves more focus.
When combined with BSR-based sales estimates, this approach allows you to evaluate not just how well a paperback might sell — but whether it makes financial sense at all.
Trust, Transparency, and Important Limitations
Amazon does not publicly disclose exact book sales data. Any BSR-based calculator works with estimates — not official reports. This section explains what this tool does well, what it does not attempt to predict, and how to use the results responsibly.
Understanding these limitations will help you get far more value from the calculator and avoid common misinterpretations.
What this calculator is based on
- Observed relationships between Amazon BSR and sales velocityacross multiple categories and formats.
- Typical KDP royalty rules for Kindle ebooks and Paperback books.
- Seasonal distribution patterns used to visualize monthly trends, not to predict exact calendar dates.
What this calculator does NOT account for
- Kindle Unlimited page reads and KU payout fluctuations
- Advertising spend, bids, and campaign performance
- Promotions, giveaways, or free days
- Returns, refunds, or delayed royalty adjustments
- External costs such as editing, cover design, or formatting
Why estimates still matter
Even with these limitations, BSR-based estimates remain one of the most practical tools available to authors and publishers. The key is using them for comparison and planning, not for exact forecasting.
- Compare demand between niches before writing or publishing
- Evaluate whether price or format changes improve profitability
- Understand relative performance between similar books
When used consistently and with realistic expectations, this calculator provides clarity — not certainty. It helps you make better KDP decisions based on patterns, not guesses or isolated data points.
Frequently Asked Questions About Amazon BSR Estimates
Below are answers to common questions authors and publishers ask when using a BSR calculator for sales, royalties, and profit estimation.
If you have additional questions, use the calculator with different scenarios to build intuition. Over time, pattern recognition matters more than any single estimate.
Final Thoughts: Use BSR Estimates to Make Smarter KDP Decisions
Amazon Best Sellers Rank will never give you exact sales numbers — but when used correctly, it provides one of the most practical signals available for understanding demand and earning potential on Amazon KDP.
This BSR calculator brings sales estimation, royalty calculation, and paperback profit checks into a single workflow. It is designed to help you compare opportunities, test scenarios, and make informed decisions without relying on guesswork.
Use this calculator when you want to:
- Evaluate demand before writing or publishing a new book
- Compare competitors and niches using consistent assumptions
- Test pricing, format, and seasonality scenarios
- Check whether paperback margins make financial sense
Next step: Scroll back to the calculator, enter a real BSR value, and try a few scenarios. Focus on patterns and comparisons — not exact numbers — to get the most value from your estimates.
Over time, using BSR-based estimates consistently will sharpen your intuition and help you make better KDP decisions with greater confidence.